Research
My research focuses on topics in visualization, data analytics, visual design, and computer graphics driven by real-world challenges. Below is a sample of on-going projects in my research group. For more information about these projects or others, please contact me. A complete list of publications can be found here
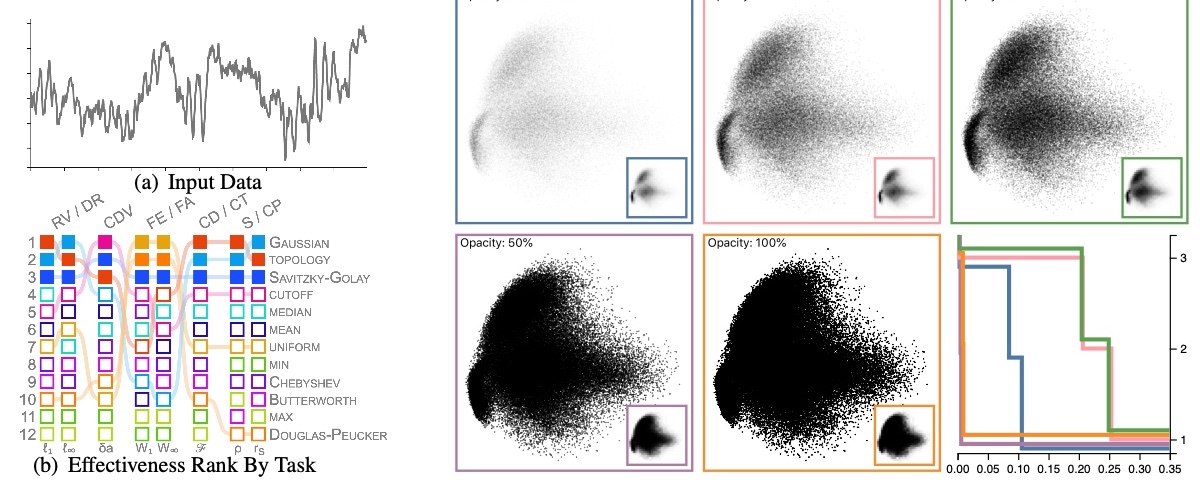
An optimized visualization design renders a graph that would improve data communication and interpretation, leading to better decision-making. However, design guidelines focus on effective visualization design that depends on the visualization types, visual channels used, or specific visual tasks but independently, leading to a significant need to understand the intersection of these factors to create optimized visualizations. A design framework at the intersections of visual encoding and low-level tasks fills the gap between guidelines and application by providing a task-optimized visualization design incorporating optimized design choices supporting better performance at a given task. Our work expands on previous work by developing a framework that investigates the task effectiveness of visualization design as an ensemble of interdependent factors rather than visual elements. How can task-optimize a visualization to incorporate data clarity and allow people to extract salient patterns? How can we utilize these frameworks to provide less ambiguous data presentations, leading to better quality and higher confidence in decision-making? How can we automate visualization design optimization?
Example publication
Ghulam Jilani Quadri, Jeniffer Adorno, Brenton Wiernik, and Paul Rosen, "Automatic catterplot Design Optimization for Clustering Identification." IEEE Transactions on Visualization & Computer Graphics, 2023. PDF
Ghulam Jilani Quadri and Paul Rosen, "Modeling the Influence of Visual Density on Cluster Perception in Scatterplots Using Topology." IEEE Transactions on Visualization & Computer Graphics, 2021. PDF
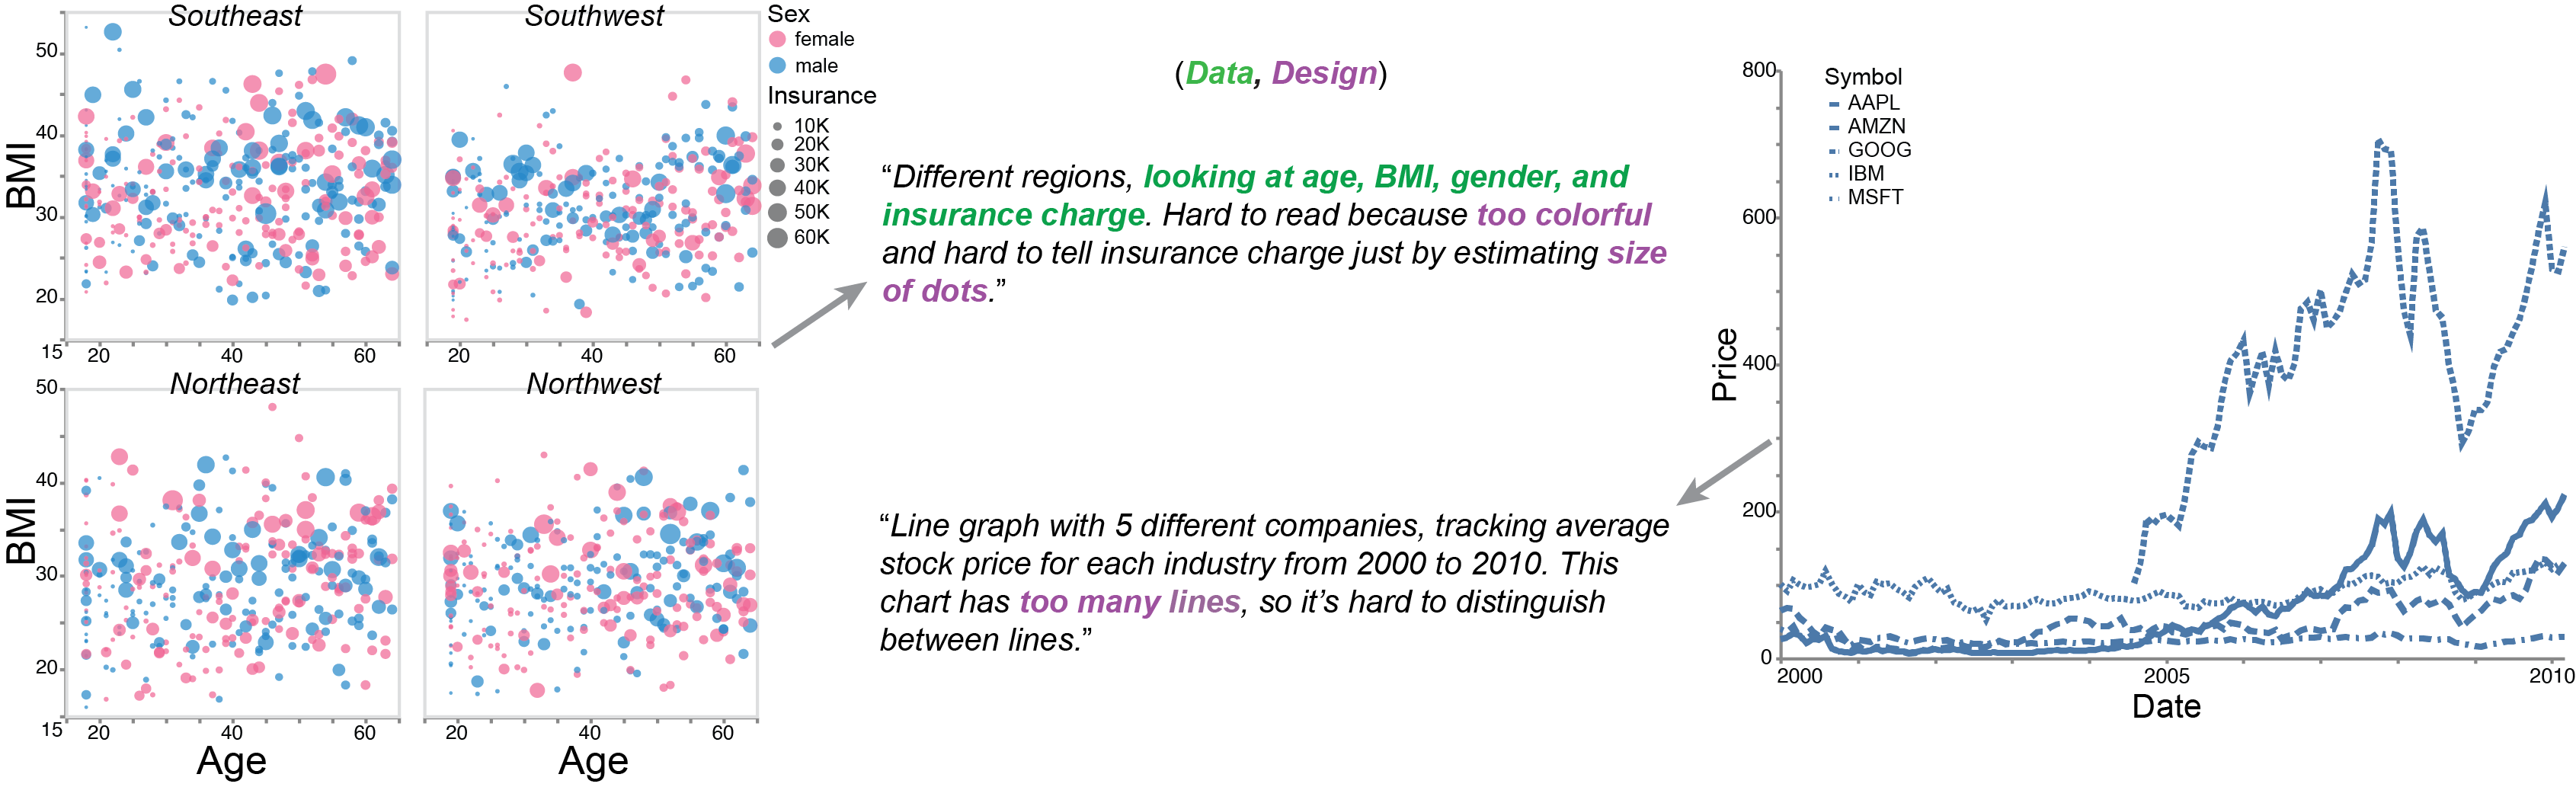
High-level Visual comprehension describes the overall knowledge a viewer intuitively gains about the data without explicit cueing or guidance. Our work investigates the high-level patterns people naturally see when encountering a visualization without a guiding task. People's interpretations vary with both the features of the visualization itself and people's backgrounds, specifically their visual literacy, familiarity with graphs and data, and educational and professional backgrounds. Does comprehension reflect the salient statistics and patterns that emerge organically from a particular combination of data and design?
Example publication
Ghulam Jilani Quadri, Arran Zeyu Wang, Zhehao Wang, Jennifer Adorno, Paul Rosen, and Danielle Albers Szafir "Do You See What I See? A Qualitative Study Eliciting High-Level Visualization Comprehension" (To be appearing) In Proceedings of ACM CHI’ 2024: ACM Conference on Human Factors in Computing Systems, 2024.
Preprint
Ghulam Jilani Quadri and Danielle Albers Szafir, "Eliciting High-Level Visual Comprehension: A Qualitative Study." In Posters IEEE VIS, 2022. PDF
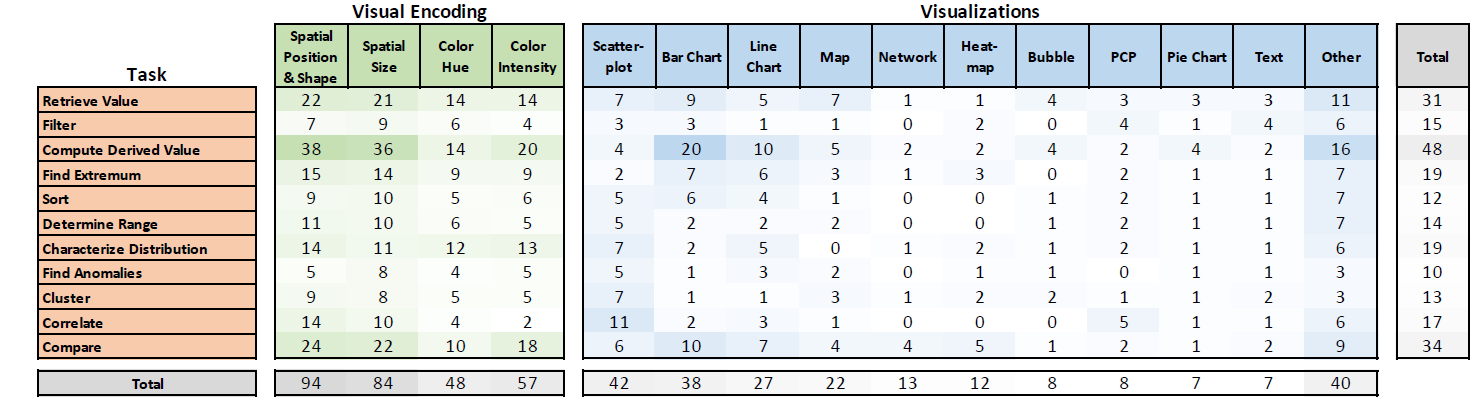
Most visualization designs and tools are built on decades-old studies and follow-ups but with limited scope. Further, we have progressed the visualization research significantly; however, we still need systematic review work to understand the progress of past studies through a taxonomy and solve the designers' and practitioners' design space problems using a framework. The curated understanding of progress guides us in advancing visualization as a research field. Systematic review provides a window into current knowledge and open research questions. Visualization research areas need to include the taxonomy of the conducted studies and their findings. How can we review findings and contextualize the results into taxonomies to understand the research developments and use them as guidance to improve visualization as a technique for data communication applications? How can we investigate parallel problems such that results should be formed into a practical design space framework that solves the challenges in that space?
Example publication
Ghulam Jilani Quadri and Paul Rosen, "A Survey of Perception-Based Visualization Studies by Task." IEEE Transactions on Visualization & Computer Graphics, 2021. PDF
Ghulam Jilani Quadri, and P. Rosen, “You Can’t Publish Replication Studies (and How to Anyways),” In Proceedings of VIS 2019: IEEE Conference on Visualization. Workshop on Vis X Vision, 2019. PDF
Reproducibility has been increasingly encouraged by science communities to validate experimental conclusions, and replication studies represent a significant opportunity to vision scientists wishing to contribute new perceptual models, methods, or insights to the visualization community. Unfortunately, the notion of replicating previous studies does not lend itself to how we communicate research findings. Simply put, studies that re-conduct and confirm earlier results do not hold any novelty, a key element to the modern research publication system. Nevertheless, savvy researchers have discovered ways to produce replication studies by embedding them into other, sufficiently novel studies. In this position work, we define three methods---re-evaluation, expansion, and specialization---for implanting a replication study into a novel published work. Finally, we discuss how publishing a true replication study should be avoided while providing suggestions for how vision scientists and others can still use replication studies as a vehicle to producing visualization research publications.
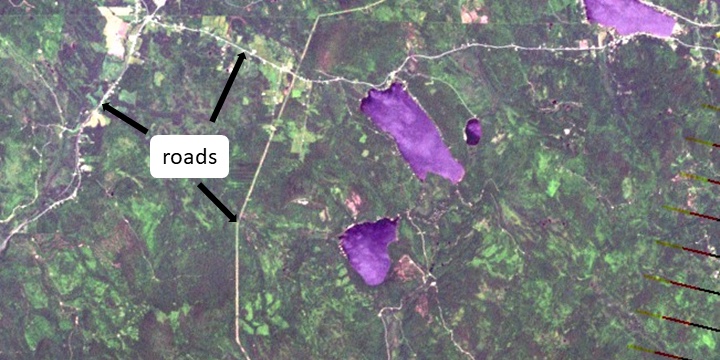
S. Malla, A. Tuladhar, Ghulam Jilani Quadri, and P. Rosen, “Multi-Spectral Satellite Image Analysis for Feature Identification and Change Detection VAST Challenge 2017: Honorable Mention for Good Facilitation of Single Image Analysis,” Proceedings of the IEEE Conference on VAST, October 2017. (Link | PDF)